BMI and Climbing Part 2, Elite Climbers
We’ve already looked at BMI in climbing a couple of times, first in our own data and secondly looking at an overview of some numbers from 8a.nu. Today we’re going to have a look at the 8a.nu numbers in a little more detail.
In particular, we’re interested in seeing if there is a correlation between climbing grade and BMI in the 8a.nu top 100 ranking female/boulder/sport climbers. The tricky thing here is deciding what we mean by ‘climbing grade’! A seemingly easy question but it has a lot of different answers! For simplicity, we’re going to use a similar definition to what we use in our own dataset: “What’s the hardest route/boulder problem climbed in the last 2 years?”
Let’s get stuck in!
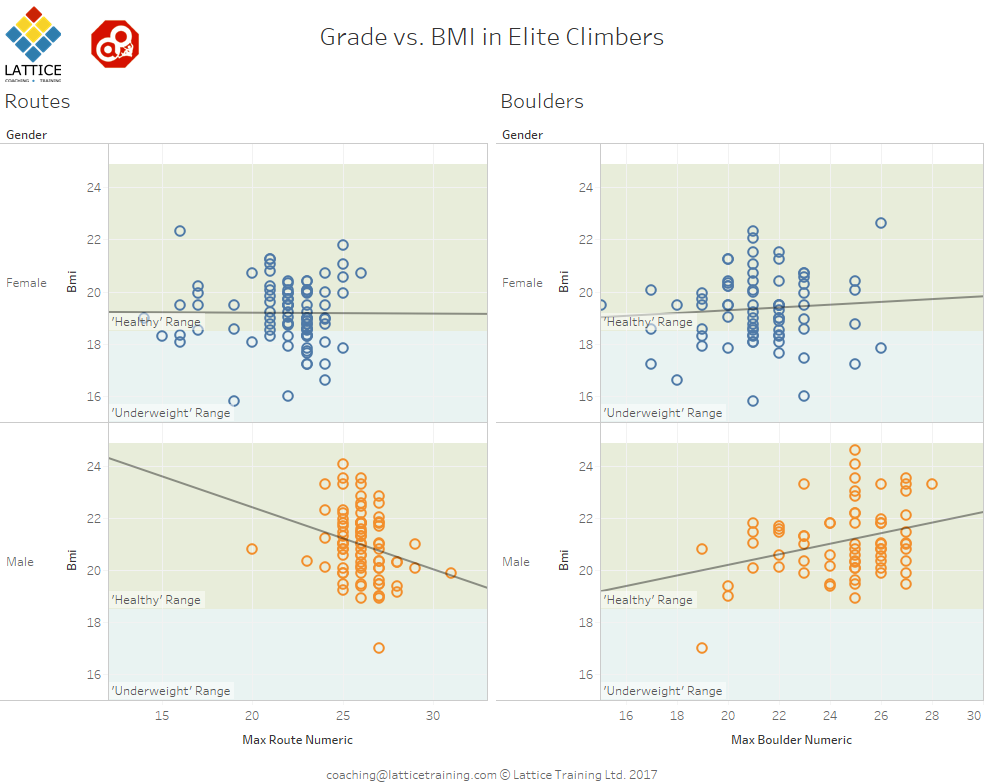
There’s a couple of interesting points here. Firstly, in line with our initial look at this data, the vast majority of male climbers in this sample are in the ‘healthy’ 18.5 to 24.9 BMI range. The majority of the female climbers in the sample are also in the healthy range, but there’s a significant group who would fall in to the ‘underweight’ band.
Looking at the linear models fitted to the data we can see that they don’t match the data very closely, so our analysis based on these models needs to be taken with a large grain of salt.
For the male climbers there are some interesting correlations between grade and BMI. In particular, there appears to be a slight negative correlation with route grade while there appears to be a slight positive correlation with boulder grade. This suggests that in the male climbers in this sample, the better route climbers tend to have relatively low BMIs, whereas the better boulderers tend to have relatively high BMIs. It is important to remember that all these climbers are still in the ‘healthy’ range.
Interestingly the above trends aren’t present in the female climbers in this sample (or are far less pronounced). This could be because the models aren’t as good here or it could be an actual difference. Without more data it is hard to say for sure.
Keep an eye out for part 3 of this series, where we’ll look at data from a wider range of climbers on 8a.nu.
Notes: In previous posts we’ve had a few questions about how the grade scales are calculated. i.e. what does a route grade of 25 mean? The grade scales are straight maps of french sport grades and font boulder grades to integers. i.e. for routes 25 = 8c, 26 = 8c+ etc. For boulders, 25 = 8B, 26 = 8B+ etc.


Uhh, so you have the hardest female route completed at 8c+? There have been a bunch of 9a’s, plus three women have climbed 9a+ and one has climbed 9b. Were all of these after your data were collected?!
Hi Jake, yeah the dataset is not comprehensive, just whoever was in the 8a.nu top 100 ranking at the time. For example, Angela Eiter (first female ascent of Planta de Shiva, 9b) doesn’t maintain an 8a.nu logbook scorecard so she’s not included in the data.
Thanks for the great research. I was doing the same research today and unfortunately I realized the 8a data is flawed to the point of not being usable.
The weights are either a guess or there is not the option for a precise number. For example every weight in the 70’s is either 73 kg or 78kg…same with all other ranges as well. So there is a huge margin of error of plus or minus 5kg, which in climbing terms is huge!
Realize the 8a data is a great resource, maybe I will submit a request for them to update the weight input system.
Interesting results here. Have you got any data looking at individuals changing BMI over a shortish period of time? This might eliminate to a certain extent variations due to technical proficiency. i.e. climbers with low BMI but poor technical abilities compared to a high BMI climber may be obscuring correlations etc
If there is no longitudinal data, having a technical proficiency score from the lattice board could be included into the analysis and accounted for.
Also wondering if fat percentage might be a better bio-marker that correlates with overall grade etc
cheers, Scott