What is the number 1 measure of performance for sport climbers?
Introduction:
We were interested to understand what predictor was the best for each ability level. As the grade increases in climbing, the complexity increases. The demands of the routes become more strenuous with them requiring climbers to use smaller holds, fewer fingers, climb longer sustained sequences or short more powerful sequences. This creates a unique environment which a single test cannot capture. With the increase in demands as the grade increases we wanted to understand if the best predictor changes as ability level increases. Therefore, we conducted a mini-test on our remote assessment data to 1) understand how a specific metric predicted route climbing performance and 2) how this changed across ability levels.
In this study, we aimed to identify which predictor(s) were most effective at each climbing ability level. As climbers progress to higher grades, the demands of the routes become increasingly complex — requiring the use of smaller holds, fewer fingers, and the ability to sustain longer sequences or execute shorter, more powerful movements. This combination of physical demands creates a multifaceted performance profile that cannot be fully captured by a single test.
We wanted to determine whether the most effective predictor changes with ability level. To explore this, we analysed data from our Remote Assessment to: 1) evaluate how well a specific metric predicted route climbing performance, and 2) assess how this relationship varied across ability levels.
Methodology:
Participants:
436 participants were used in our analysis. These were a small subset of our Remote Assessment data pool. 367 of the participants were male, 55 were female, and the remaining 14 did not define their sex. Grades ranged from 6c to 9b+. The table below details the anthropometrics of the groups.
| Table 1: Anthropometrics across all ability levels. | |||||||
| Ability Level | Height (cm) Mean | Weight (kg) Mean | Arm Span (cm) Mean | Participants | |||
| Mean | SD (+/-) | Mean | SD (+/-) | Mean | SD (+/-) | ||
| Combined | 176.01 | 12.07 | 70.03 | 9.04 | 179.76 | 13.11 | 436 |
| Intermediate | 182.00 | 76.00 | 192.00 | 1 | |||
| Advanced | 176.67 | 9.45 | 71.89 | 9.95 | 180.35 | 10.54 | 182 |
| Elite | 176.54 | 8.23 | 69.17 | 8.08 | 180.27 | 9.36 | 210 |
| Higher Elite | 170.50 | 27.42 | 66.20 | 7.76 | 174.48 | 28.81 | 43 |
Procedure:
We examined 3 key tests used in our Remote Assessment:
- Finger strength
- Critical force
- Pulling strength
These tests were conducted in the athletes’ own time and at a facility of the athletes’ choice.
Finger Strength Test
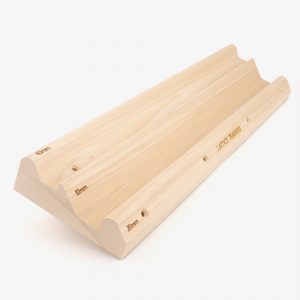
Participants completed a progressive dead-hang test on a fingerboard to determine their maximum hanging load for a duration of 7 seconds. The test was performed using both arms while maintaining their preferred grip (either a 4 finger half crimp or a 4 finger open grip). Prior to testing, participants completed a warm-up to prepare for maximal effort attempts.
The test began with a moderate-intensity hang, followed by progressively harder hangs by increasing the additional load. Participants aimed to reach their maximum load within 4-8 attempts. If more than 8 attempts were required, they were instructed to rest for 24 hours before reattempting the assessment. A test was considered unsuccessful if the grip position changed during the hang, in which case the last successful attempt was recorded.
The maximum loading was calculated as the sum of the participant’s body weight and the additional load.
The following data were recorded:
- Fingerboard used
- Depth of the hold (18 mm, 20 mm, or 22 mm edge)
- Total load (kg) (body weight plus additional weight added or removed)
- Percentage bodyweight (%BW – ((Total load/ bodyweight) x 100))
Critical Force Test
Participants completed three time-to-exhaustion tests over three separate sessions, each spaced 48 hours apart. Test intensities were prescribed based on the participant’s previously established 7-second maximum hang total load. On the first testing day, participants completed the 50% load condition, followed by the 70% condition on the second day, and the 60% condition on the third day.
Each test consisted of repeated isometric dead-hangs performed on a standard edge, using the prescribed percentage (50%, 60%, or 70%) of the participant’s maximum load. Each repetition comprised a 7-second hang followed by a 3-second rest and was repeated until failure. Failure was defined as either the inability to complete the full 7-second hang or any deviation from the prescribed grip position.
Participants were required to maintain an elbow angle between 150° and 180° throughout the test and were instructed to avoid locking off at any point. The external load was calculated as:
(Body mass + additional load from the max hang test) × intensity (0.50, 0.60, or 0.70).
Assistance was provided via a pulley system when required to reach the appropriate target load.
The following data were recorded for each test:
- Total time under tension (s) across successful hangs (Tlim)
- Total load (kg) used, including bodyweight and any added or subtracted load
Critical Force (CF) and W′ Calculation
The Wlim for the intermittent isometric contractions was calculated as the product of the force (F) and total time under tension (Tlim). Linear regression was used to model the relationship between force and time, using the 1/time model:
where:
- F is the force applied (kg),
- Tlim is the time to exhaustion (s),
- W′ is the curvature constant representing the anaerobic work capacity (kg·s),
- CF is the critical force (kg)
The slope of this regression provided the estimate of W′, while the y-intercept represented CF. This approach was based on previously validated methods for determining critical force in intermittent isometric contractions.
CF (%BW) was calculated with the following equation ((Total load/ bodyweight) x 100)).
Pulling Strength Test
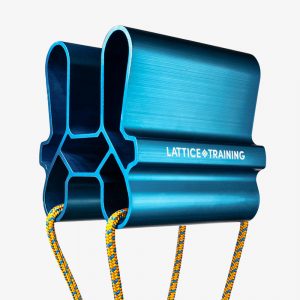
Participants performed a two-repetition maximum (2RM) pull-up test using additional weight to assess their maximal pulling strength. Weight was added using a harness or sling. Participants rested for 3 minutes between each attempt to progressively determine their maximum load.
The pull-ups were performed with a shoulder-width grip, palms facing away. Each repetition was executed from nearly straight arms to the chin reaching the bar, in a controlled manner without lower body movement.
The following data were recorded:
- Total load (kg) (body weight plus additional weight added or removed)
- Percentage bodyweight (%BW – ((Total load/ bodyweight) x 100))
Statistical Analysis
Before the analysis was conducted, the data was cleaned for outliers. Further, the data was cleaned a second time to remove bouldering specialists. The athlete’s best boulder worked grade and best sport worked grade were compared, and if there was a difference of 2 in favour of bouldering, the athlete was removed. This reduced the dataset from 942 to 436.
A simple linear regression analysis was conducted to examine the relationship between individual predictor variables (7 second max hang % Bodyweight, Pull-Up 2RM % Bodyweight, %BW Critical Force) and climbing performance, measured as the highest route grade worked within a two-year period. The analysis was performed separately for each predictor to evaluate its independent contribution to performance across different ability levels (Combined, Advanced, Elite, and Higher Elite). Due to the size of the intermediate group they were removed.
For each regression model, the grade (Y) was the best-worked route grade, and ingrade (X) was the selected predictor: Finger strength, pulling strength, or critical force.
Model performance was assessed using several regression metrics. The coefficient of determination (R) was reported to indicate the proportion of variance in climbing grades explained by the predictor, while adjusted R² was used to correct for sample size differences and prevent overestimation of explanatory power. The regression coefficient (β1) and its standard error were calculated to estimate the magnitude and uncertainty of the predictor’s effect. The p-value were used to assess statistical significance, with thresholds set at p<0.05 for significance and p<0.001 for highly significant relationships. In addition, 95% confidence intervals (CIs) were computed to provide a range within which the true effect size is likely to fall. The F-statistic was used to test the overall significance of the model, and the Durbin-Watson statistic was included to assess autocorrelation in residuals.
To ensure that regression assumptions were met, multiple diagnostic tests were performed. The normality of residuals was evaluated using Q-Q plots and Shapiro-Wilk tests to confirm that errors were normally distributed. Homoscedasticity, or constant variance of residuals, was checked using residual plots to ensure that error variance remained stable across fitted values. Linearity between predictors and the grade was verified through scatterplots of residuals against fitted values. Additionally, Cook’s Distance and Leverage Plots were used to detect influential data points that could unduly affect model estimates.
Disclaimer. While these results help isolate the individual contributions of each variable, a multivariate or mixed-model approach would allow for a more integrated understanding of their combined and interactive effects. This is something that we plan to explore in future blog posts.
Results:
Number 1 – Finger strength
This test represents the maximum amount of weight an athlete can hold on 2 arms on a 20mm edge for 7 seconds. The score is presented as a percentage of bodyweight. Typically this test is a good indicator of finger strength.
A regression analysis was conducted using the combined dataset, with best route worked as the dependent variable and 7-sec Max Hang (%BW) as the predictor. The analysis yielded a correlation coefficient (R) of 0.660, indicating a moderate-to-strong relationship between the variables. The model explained 43.6% of the variance in the dependent variable (R² = 0.436). A significant effect was observed, F(1, 420) = 324.32, p < 0.001, demonstrating that the model provides a statistically significant explanation of variation in the best route worked.
Number 2 – Pulling strength
This test represents the maximum amount of weight an athlete can pull for 2 repetitions in the pronated pull-up position. The score is presented as a percentage of body weight. Typically this test is a good indicator of upper body pulling strength.
A regression analysis was conducted using the combined dataset, with the best route worked as the dependent variable and 2-rep max pull-ups (%BW) as the predictor. The analysis yielded a correlation coefficient (R = 0.535), indicating a moderate positive relationship between the variables. The model explained 28.6% of the variance in best route worked (R² = 0.286), suggesting that while 2-rep max pull-ups (%BW) are a significant predictor, other factors contribute substantially to performance. A significant effect was observed, F(1, 420) = 168.39, p < 0.001, confirming that the model provides a statistically significant explanation of variation in best route worked.
Number 3 – Critical Force (%BW)
This test represents the greatest metabolic rate that results in wholly oxidative energy provision during intermittent contractions of the finger flexors and extensors, distinguishing between steady and non-steady state conditions. We calculate critical force through a series of time-to-exhaustion tests working at intensities derived from the 7-second max hang test. The score is presented as a percentage of body weight. Typically, this test is a good indicator of an athlete’s aerobic capacity
A regression analysis was conducted using the combined dataset, with the best route worked as the dependent variable and Critical Force (%BW) as the predictor. The analysis yielded a correlation coefficient (R = 0.401), indicating a moderate positive relationship between the variables. The model explained 16.0% of the variance in best_route_worked (R² = 0.160), suggesting that while Critical Force (%BW) is a significant predictor, a substantial proportion of the variance remains unexplained. A significant effect was observed, F(1, 420) = 80.28, p < 0.001, confirming that the model provides a statistically significant explanation of variation in the best route worked.
What does this mean?
Strength-based metrics are important for understanding sport climbing performance. Unlike bouldering performance, endurance plays an important role in performance and should be considered in exercise prescription.
How does this change across ability levels?
| Table 2: The mean and standard deviation for each metric across the ability levels. | ||||||||||||
| Metric | Advanced | Elite | Higher Elite | |||||||||
| Lower (7a) | Upper (7b+) | Lower (7c) | Upper (8b+) | Lower (8c) | Upper (9a) | |||||||
| M | SD (+/-) | M | SD (+/-) | M | SD (+/-) | M | SD (+/-) | M | SD (+/-) | M | SD (+/-) | |
| 7-sec Max Hang (%BW) | 124.28 | 14.34 | 134.20 | 14.80 | 138.40 | 15.06 | 163.66 | 15.34 | 170.19 | 15.35 | 190.09 | 19.22 |
| 2-rep max pull-ups (%BW) | 127.27 | 14.38 | 136.77 | 14.15 | 140.53 | 15.70 | 155.12 | 12.62 | 157.85 | 13.26 | 167.42 | 15.92 |
| Critical Force (%BW) | 29.05 | 25.23 | 39.77 | 24.75 | 41.68 | 24.55 | 55.64 | 23.76 | 55.75 | 33.07 | 72.81 | 12.83 |
Advanced (7a – 7b+)
| Table 3: Linear Regression Results for Advanced Climbers | |||||||
| Predictor | R | Adjusted R² | F(1,173) | P-Value | Regression Coefficient | Confidence Interval Lower | Confidence Interval Upper |
| 7-sec Max Hang (%BW) | 0.285 | 0.076 | 15.292 | p < 0.001 *** | 0.021 | 0.010 | 0.031 |
| 2-rep max pull-ups (%BW) | 0.295 | 0.082 | 16.470 | p < 0.001 *** | 0.022 | 0.011 | 0.033 |
| Critical Force (%BW) | 0.160 | 0.020 | 4.529 | 0.035 * | 0.007 | 0.001 | 0.014 |
| Note. *** = p < 0.001, * = p < 0.05 | |||||||
7-sec Max Hang has a small to moderate predictive power with R = 0.285 and an adjusted R² of 0.076, meaning about 8% of the variation in grade can be explained by this variable. The p-value is < 0.001, confirming strong statistical significance. The regression coefficient (0.021) indicates that for each unit increase in 7-sec Max Hang (% bodyweight), the grade increases by 0.021 units.
2-rep Max Pull-ups is another significant predictor, with R = 0.295 and an adjusted R² of 0.082, meaning approximately 8% of the variation in performance is explained by this variable. The regression coefficient (0.022) suggests that an increase in Pull-up Strength results in a 0.022-unit increase in grade. The p-value is < 0.001, confirming high statistical significance.
Critical Force has a low adjusted R² of 0.020, meaning it explains only 2% of the variation in climbing grade. While the p-value of 0.035 indicates statistical significance at the p < 0.05 level, the regression coefficient (0.007) is small, suggesting that Critical Force has a limited impact on performance in advanced climbers.
Summary for Advanced Climbers
- 2-rep Max Pull-ups and 7-sec Max Hang are statistically significant and explain a modest amount of variation in performance (~8% each), indicating they are important strength-based predictors.
- Critical Force is statistically significant but explains very little variance and has a small effect size, suggesting it is a weaker predictor of climbing grade in advanced climbers.
Elite (7c – 8b+)
| Table 4: Linear Regression Results for Elite Climbers | |||||||
| Predictor | R | Adjusted R² | F(1,202) | P-Value | Regression Coefficient | Confidence Interval Lower | Confidence Interval Upper |
| 7-sec Max Hang (%BW) | 0.382 | 0.141 | 34.425 | p < 0.001 *** | 0.024 | 0.016 | 0.031 |
| 2-rep max pull-ups (%BW) | 0.193 | 0.032 | 7.818 | 0.006 ** | 0.013 | 0.004 | 0.022 |
| Critical Force (%BW) | 0.235 | 0.051 | 11.820 | p < 0.001 *** | 0.013 | 0.006 | 0.020 |
| Note. *** = p < 0.001, ** = p < 0.01 | |||||||
7-sec Max Hang shows moderate predictive power with R = 0.382 and an adjusted R² of 0.141, meaning approximately 14% of the variation in grade can be explained by this variable. The p-value is < 0.001, confirming strong statistical significance. The regression coefficient (0.024) indicates that for each unit increase in 7-sec Max Hang (% bodyweight), the grade increases by 0.024 units.
2-rep Max Pull-ups is a weaker but still statistically significant predictor, with R = 0.193 and an adjusted R² of 0.032, meaning it explains about 3% of the variation in grade. The regression coefficient (0.013) suggests that for each unit increase in Pull-up Strength (%BW), the grade increases by 0.013 units. The p-value of 0.006 confirms significance at the p < 0.01 level.
Critical Force also shows modest predictive power with R = 0.235 and an adjusted R² of 0.051, meaning it explains approximately 5% of the variation in grade. The p-value is p < 0.001, confirming high statistical significance. The regression coefficient (0.013) indicates that each unit increase in Critical Force (%BW) results in a 0.013-unit increase in grade.
Summary for Elite Climbers
- 7-sec Max Hang is the strongest predictor in this group, explaining 14% of the variance in performance and showing moderate predictive power.
- Critical Force and 2-rep Max Pull-ups are both statistically significant but explain less variance (5% and 3%, respectively), indicating smaller individual contributions to climbing performance.
- Overall, finger strength remains the most influential single predictor of the three tests, at the elite level, while pulling strength and endurance-based strength play secondary roles.
Higher Elite (8c – 9a)
| Table 5: Linear Regression Results for Higher Elite Climbers | |||||||
| Predictor | R | Adjusted R² | F(1,40) | P-Value | Regression Coefficient | Confidence Interval Lower | Confidence Interval Upper |
| 7-sec Max Hang (%BW) | 0.356 | 0.105 | 5.815 | 0.021 * | 0.026 | 0.004 | 0.048 |
| 2-rep max pull-ups (%BW) | 0.521 | 0.253 | 14.916 | p < 0.001 *** | 0.040 | 0.019 | 0.060 |
| Critical Force (%BW) | 0.301 | 0.068 | 3.998 | 0.052 | 0.024 | > 0.001 | 0.048 |
| Note. *** = p < 0.001, * = p < 0.05 | |||||||
7-sec Max Hang shows moderate predictive power with R = 0.356 and an adjusted R² of 0.105, meaning about 11% of the variation in grade can be explained by this variable. The p-value is 0.021, indicating statistical significance at the p < 0.05 level. The regression coefficient (0.026) suggests that for each unit increase in 7-sec Max Hang (% bodyweight), the grade increases by 0.026 units.
2-rep Max Pull-ups is the strongest predictor in this group, with R = 0.521 and an adjusted R² of 0.253, meaning it explains approximately 25% of the variation in grade. The regression coefficient (0.040) indicates a strong relationship, where each unit increase in Pull-up Strength (%BW) results in a 0.040-unit increase in grade. The p-value is p < 0.001, confirming high statistical significance.
Critical Force has a weaker predictive role with R = 0.301 and an adjusted R² of 0.068, explaining about 7% of the variation in grade. The p-value is 0.052, just above the standard 0.05 threshold, meaning it is not statistically significant at the conventional level. The regression coefficient (0.024) suggests a positive trend, but this result should be interpreted with caution.
Summary for Higher Elite Climbers
- 2-rep Max Pull-ups is the most powerful and significant predictor, explaining 25% of the variance in grade — suggesting that relative pulling strength is especially important at the highest levels.
- 7-sec Max Hang is also a statistically significant predictor, accounting for 11% of the variation in grade.
- Critical Force, while trending toward significance, does not reach the conventional threshold (p = 0.052) and explains only a small amount of variance. It may still contribute, but less consistently than the strength-based measures.
What do these results tell us?
- Strength is king. Whether it’s finger strength or upper body strength, maximal strength is the best predictor of climbing performance across all ability levels. Therefore, strength-based protocols should be consistent in training.
- Endurance matters. It gains importance at the elite level but is less relevant at the highest grades, suggesting that a baseline is required for the higher grades but additional improvements in critical force bring diminishing returns.
- Strength and endurance only explain part of the picture. These tests do not explain the entire variance, suggesting other factors influence performance. Make sure to dedicate time to getting on routes, practising headgame, tactics and technical execution.
Conclusion
To improve sport climbing performance you should focus on developing your strength and endurance. At different ability levels, you may find that one area has a greater focus (e.g., focusing on developing your critical force at the elite level), however, this should be considerate of the demands of your project. For example, if it is a short powerful 8b, then critical force may not be as relevant as strength or power endurance metrics.

addendum: Elite climbers may be more likely to wear beanies. That does not imply that if I put on a beanie, I’ll climb harder grades.
This is retrospective data. It’s improper to conclude “maximal strength is the best predictor of climbing performance”.
You did not find “climbers with high [metric] were more likely to exhibit higher performance.” You *did* find “climbers with higher performance were more likely to have higher [metric]”.
It does matter.
Thank you for your comment. You are absolutely right that our data is retrospective, and we appreciate you pointing out the crucial difference between correlation and causation. The beanie analogy is perfect.
We agree that it’s improper to state that increasing strength causes better performance using this data. It is not as direct and clear-cut as that. Our intention was to highlight that, among all the metrics studied, maximal strength showed the strongest statistical relationship with climbing performance. In this context, “predictor” means it was the best indicator of a climber’s likely performance, not that it’s the single factor you need to improve. I would, however, like to add that we always balance our data analysis with our experience as coaches. And we do believe that maximal strength is more than just a correlation to performance. We may not recommend beanie wearing, but we do recommend strength training. We have seen in the athletes we coach that increasing strength has, at least in part, supported greater performance.
Your feedback helps us be more precise with our language, and we’ll take that into account for future articles. Thank you again for helping us clarify this important distinction. — Coach Josh
Hey, your article is really helpfull! I just have one question:
Why do you use “%BW” for the critical force instead of “%MVC-7”? I mean if you have weak fingers and your MVC-7 is quite low you will automatically have a very low value on “%BW” critical force. If you would use “%MVC-7”, the value would indicate how much of your strength (MVC-7) is sustainably available. And in my understanding, this would be a better indicator of your aerobic capacity, wouldn’t it?
In my case I measured my CF and Peak Force with a load cell (unilateral) and the results were: PF=56%BW (40kg/ 71,4kgBW) and CF=29%BW (21kg) (This is extremely low for solid 8b sport climbing even after almost 10 years of regularly hangboarding;). But if I use %PF (which I just equate with %MVC), I end up with over 50% of my maximum strength that I can use long-term. This is quite similar to the critical force values of 9a climbers (in percentage). I know that the tests are not directly comparable, but they likely show a trend in the values.
Am I making a mistake in my thinking?
Thank you:)
It might be interesting to look beyond the highest grade each person has sent, and to also consider route style and length. That extra context could reveal a stronger correlation between critical force and grade potential—especially for more endurance-focused climbs, was that data collected during the survey, and how important do you think that is in this particular study?
Does Lattice, et al ever submit to peer review publications? If so, I’d love to see a bibliography.