Ben Moon’s Moonboard Logbook
If you know half of anything about the history of climbing you will have heard of Ben Moon; from world class first ascents such as Maginot Line at Volx and Agnicourt at Buoux to brutally hard test pieces on home soil such as Hubble at Raven Tor. These are just some of the highlights of a very impressive ticklist spanning decades of top level climbing.
Ben is also the owner of Moon Climbing who produce and sell the Moonboard. At it’s heart the Moonboard is a standardised steep board designed for training on, but the big selling point is an app and LED lighting system that allows climbers from all over the world to share the problems they create on the Moonboard with other Moonboard users.
Because Ben lives just down the road from Lattice HQ we thought it would be fun to team up and have a look at some of the data behind the Moon Board. To kick things off Ben has kindly let us have a peek at his Moonboard logbook so we can see what he’s been up to on the board!
First thing first, let’s see how hard Ben tends to climb on the board!
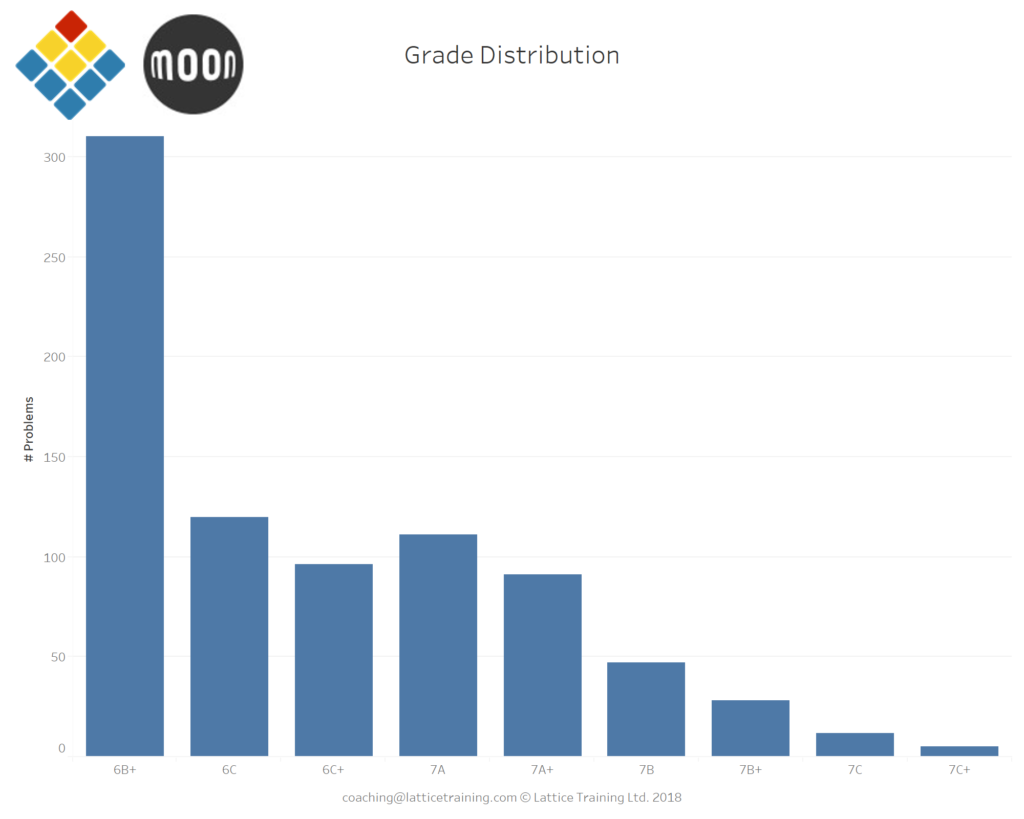

From this distribution, it looks like Ben tends to warm up between 6B+ and 7A/+, after that the number of problems at each grade decreases suggesting that things get trickier for him from 7A/+ upwards. Given that Ben’s climbed up to 8B+ outdoors it’s interesting to note that there’s not a lot of harder problems in his logbook. It might be informative to take a look at how many attempts he tends to take on things as this will tell us a lot about the style of his sessions.
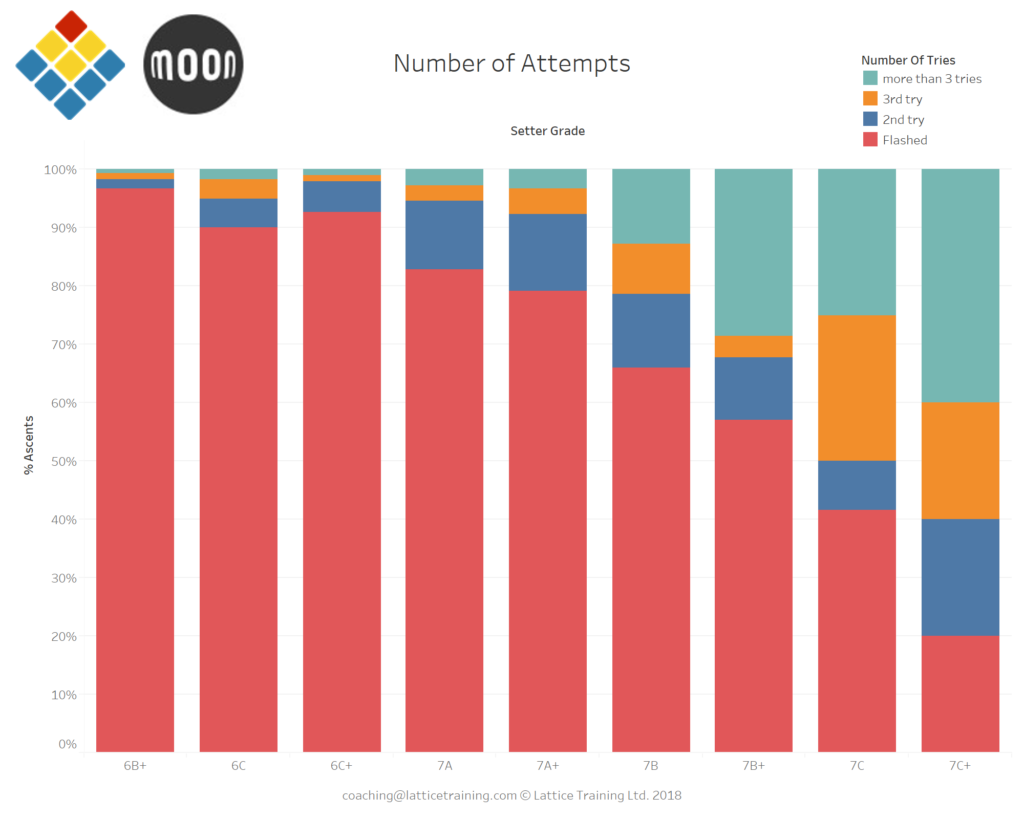

Looking at this we can see that Ben tends to flash a large proportion of the problems he tries. This would explain why there’s not a lot of 8th grade problems logged as it appears that his focus is on doing problems quickly.
Grading is always a contentious issue so the Moon Board app lets users vote on how hard they think the problems they’ve climbed are. The data we’ve got includes all Ben’s grade votes so we can see how he thought problems compared to their set grade. To compare the setters grade with Ben’s grade I gave each grade a numeric score (6A = 1, 6A+ = 2 etc.) The graph below shows average(Ben’s grade – Setter grade), grouped by setter grade. If a boulder problem gets a positive score it means Ben upgraded it and if it gets a negative score it means he downgraded it.
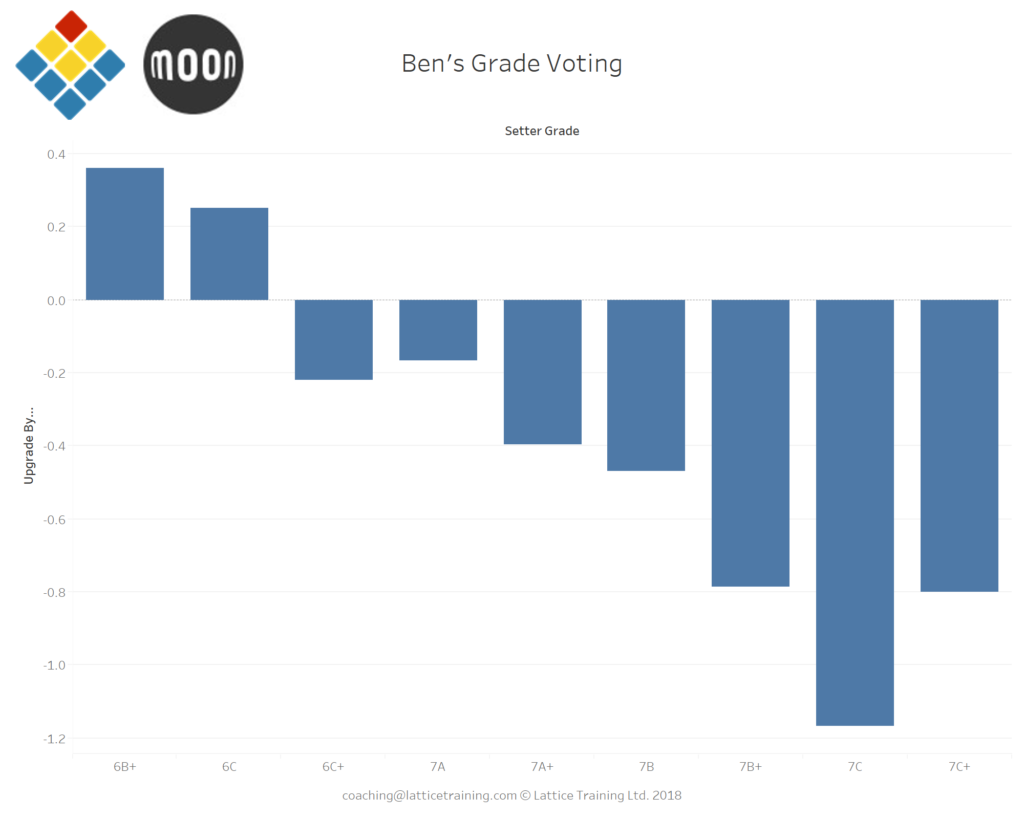

This shows an interesting trend; compared to the broader population of setters Ben has tended to upgrade low grade problems and downgrade higher grade problems. Interestingly the effect seems to be pretty linear, so the size of an up/down grade is roughly proportional to the grade of the problem with the mid-point being ~6C/+.
Because anyone can submit a problem and give it any grade they like there’s a feature in the app that let’s you see only problems that are considered ‘Benchmarks’. These are problems that Ben and a handful of trusted associates have climbed and are deemed to be good quality problems at about the right grade. If we look at problems marked as benchmarks we see this very clearly.
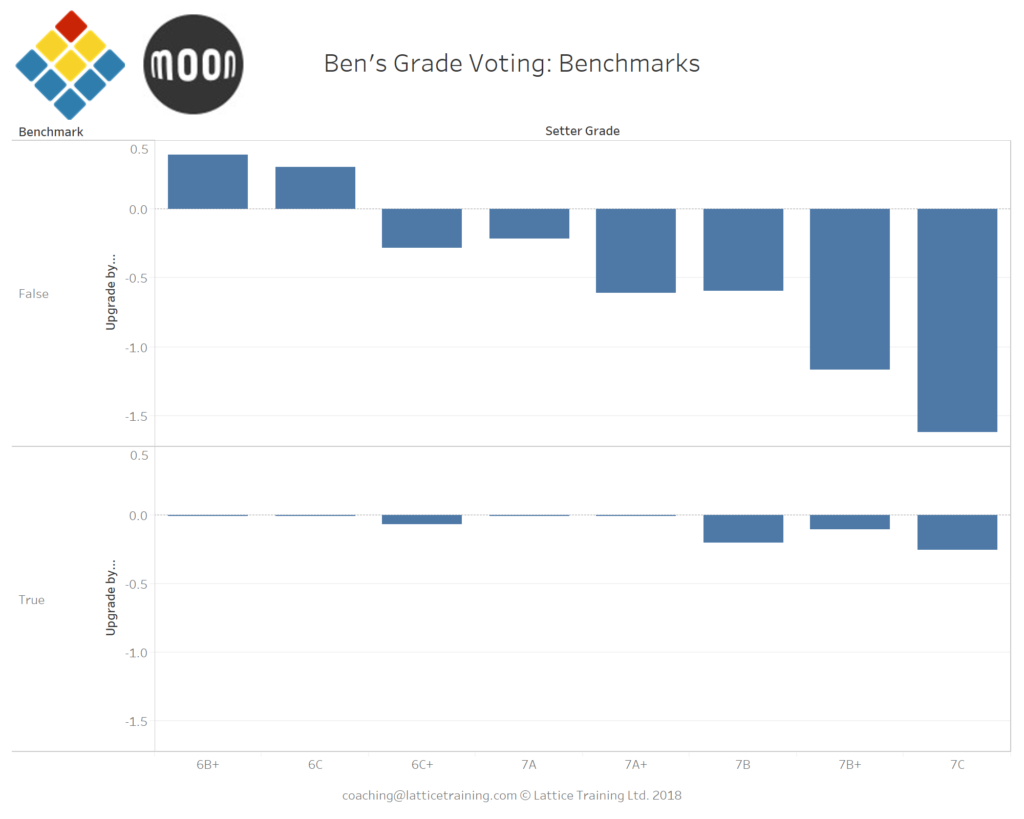

Notice that, as expected, Ben does a lot less up/down grading for problems that are benchmarks compared to non-benchmark problems. That is, the problems he chooses as benchmarks are ones where he feels the grade is about right.
Finally let’s look at the really important question…what’s the best day for sending your big project?!
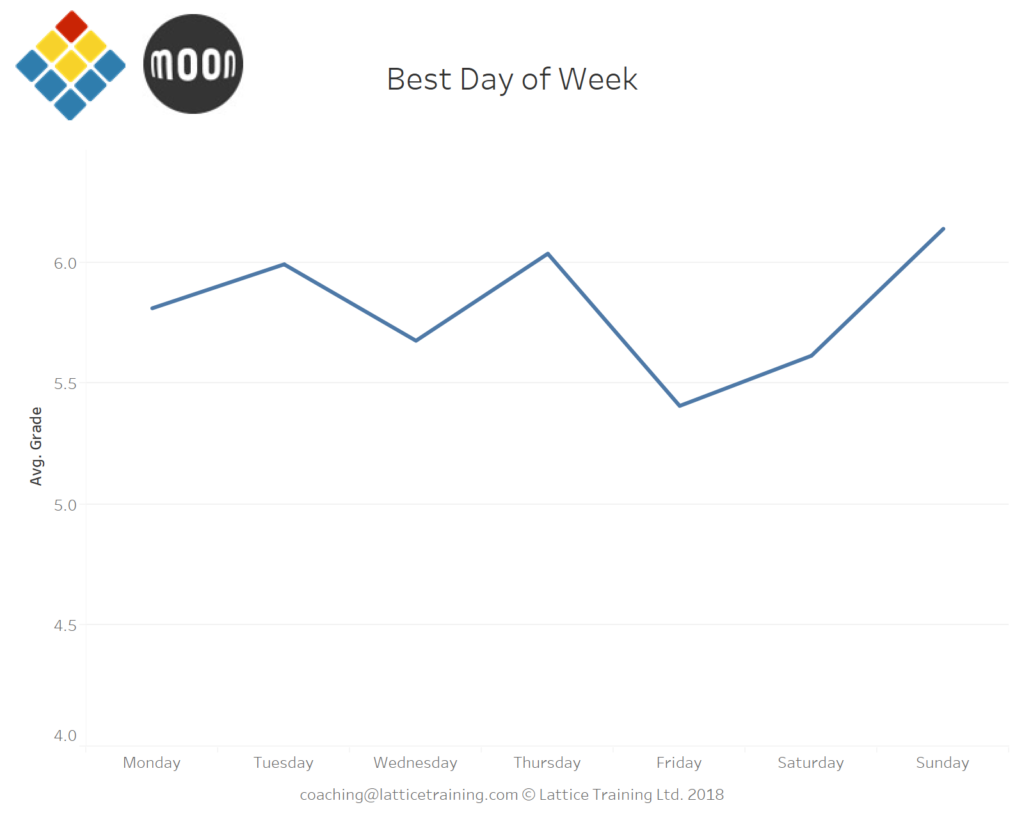

It looks like Tuesdays, Thursdays and Sundays are all good bets. Adam Ondra hits peak performance on Thursdays too, so my money is on Thursday for the big redpoint! Go forth and dispatch.