Analytics
Your sends by grade, your form and your training time on the Analytics tab.
The Analytics tab shows your training and your climbing over time. Open it from the tab bar at the bottom of the screen.
Sends by grade
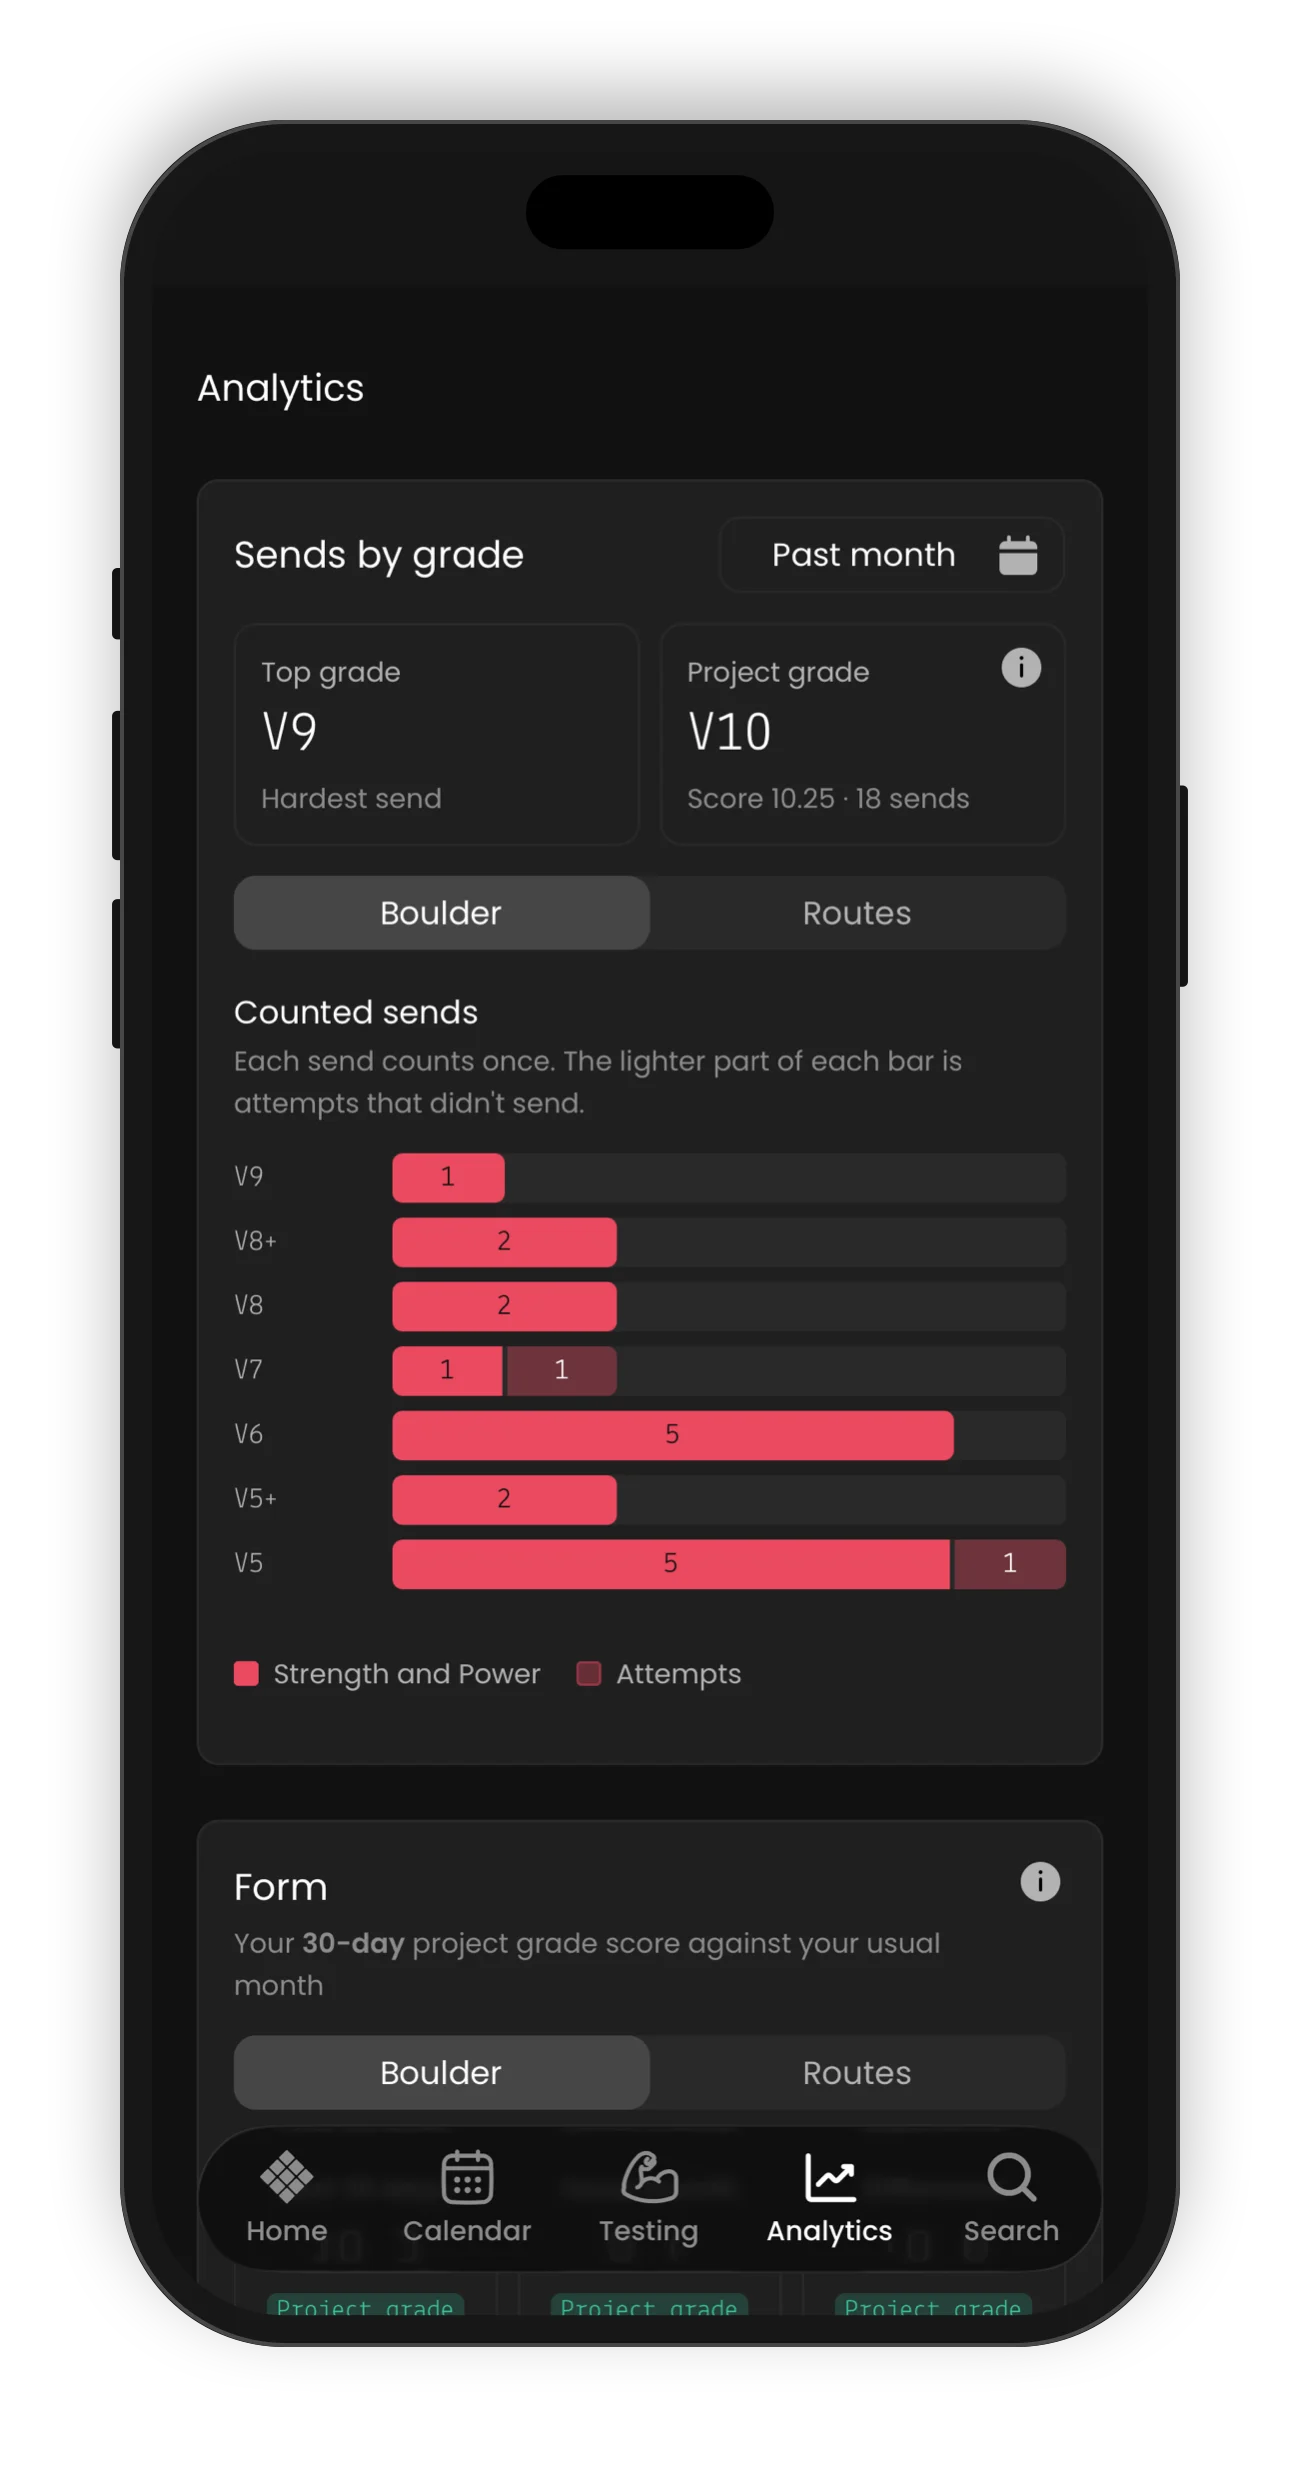
Sends by grade shows how many climbs you sent at each grade. It uses the graded climbs that you log. Choose Boulder or Routes.
Indoor or outdoor grades? Either is fine. Log the grades that matter most to your climbing.
At the top, two values show:
- Top grade: your hardest send.
- Project grade: one grade that adds up all your sends. Harder sends count for much more than easier sends. To see how we work it out from your sends, tap the (i).
Each bar is one grade. The bright part is your sends. The lighter part is attempts that did not send. Tap an item in the key to hide or show it.
To change the period, tap the time frame at the top right. Choose This week, Past month, Past 3 months, Past year or All. The default is Past month.
Form
Form compares your project grade score in the last 30 days with your usual month. It shows if you climb above, in or below your usual range. Choose Boulder or Routes.
- Last 30 days: your project grade score for the last 30 days.
- Usual month: your middle score of the past year. Half your weeks score above it, and half score below.
- Difference: the last 30 days minus your usual month.
The line shows your 30-day score, week by week, over the past year. The shaded band is your usual range. A gap in the line means no sends in those 30 days.
Under the chart, the app tells you if you are in, above or below your usual range. To see your usual month, Form needs sends in at least 8 weeks of the past year. To see how we work it out, tap the (i).
Training time, workouts and training load
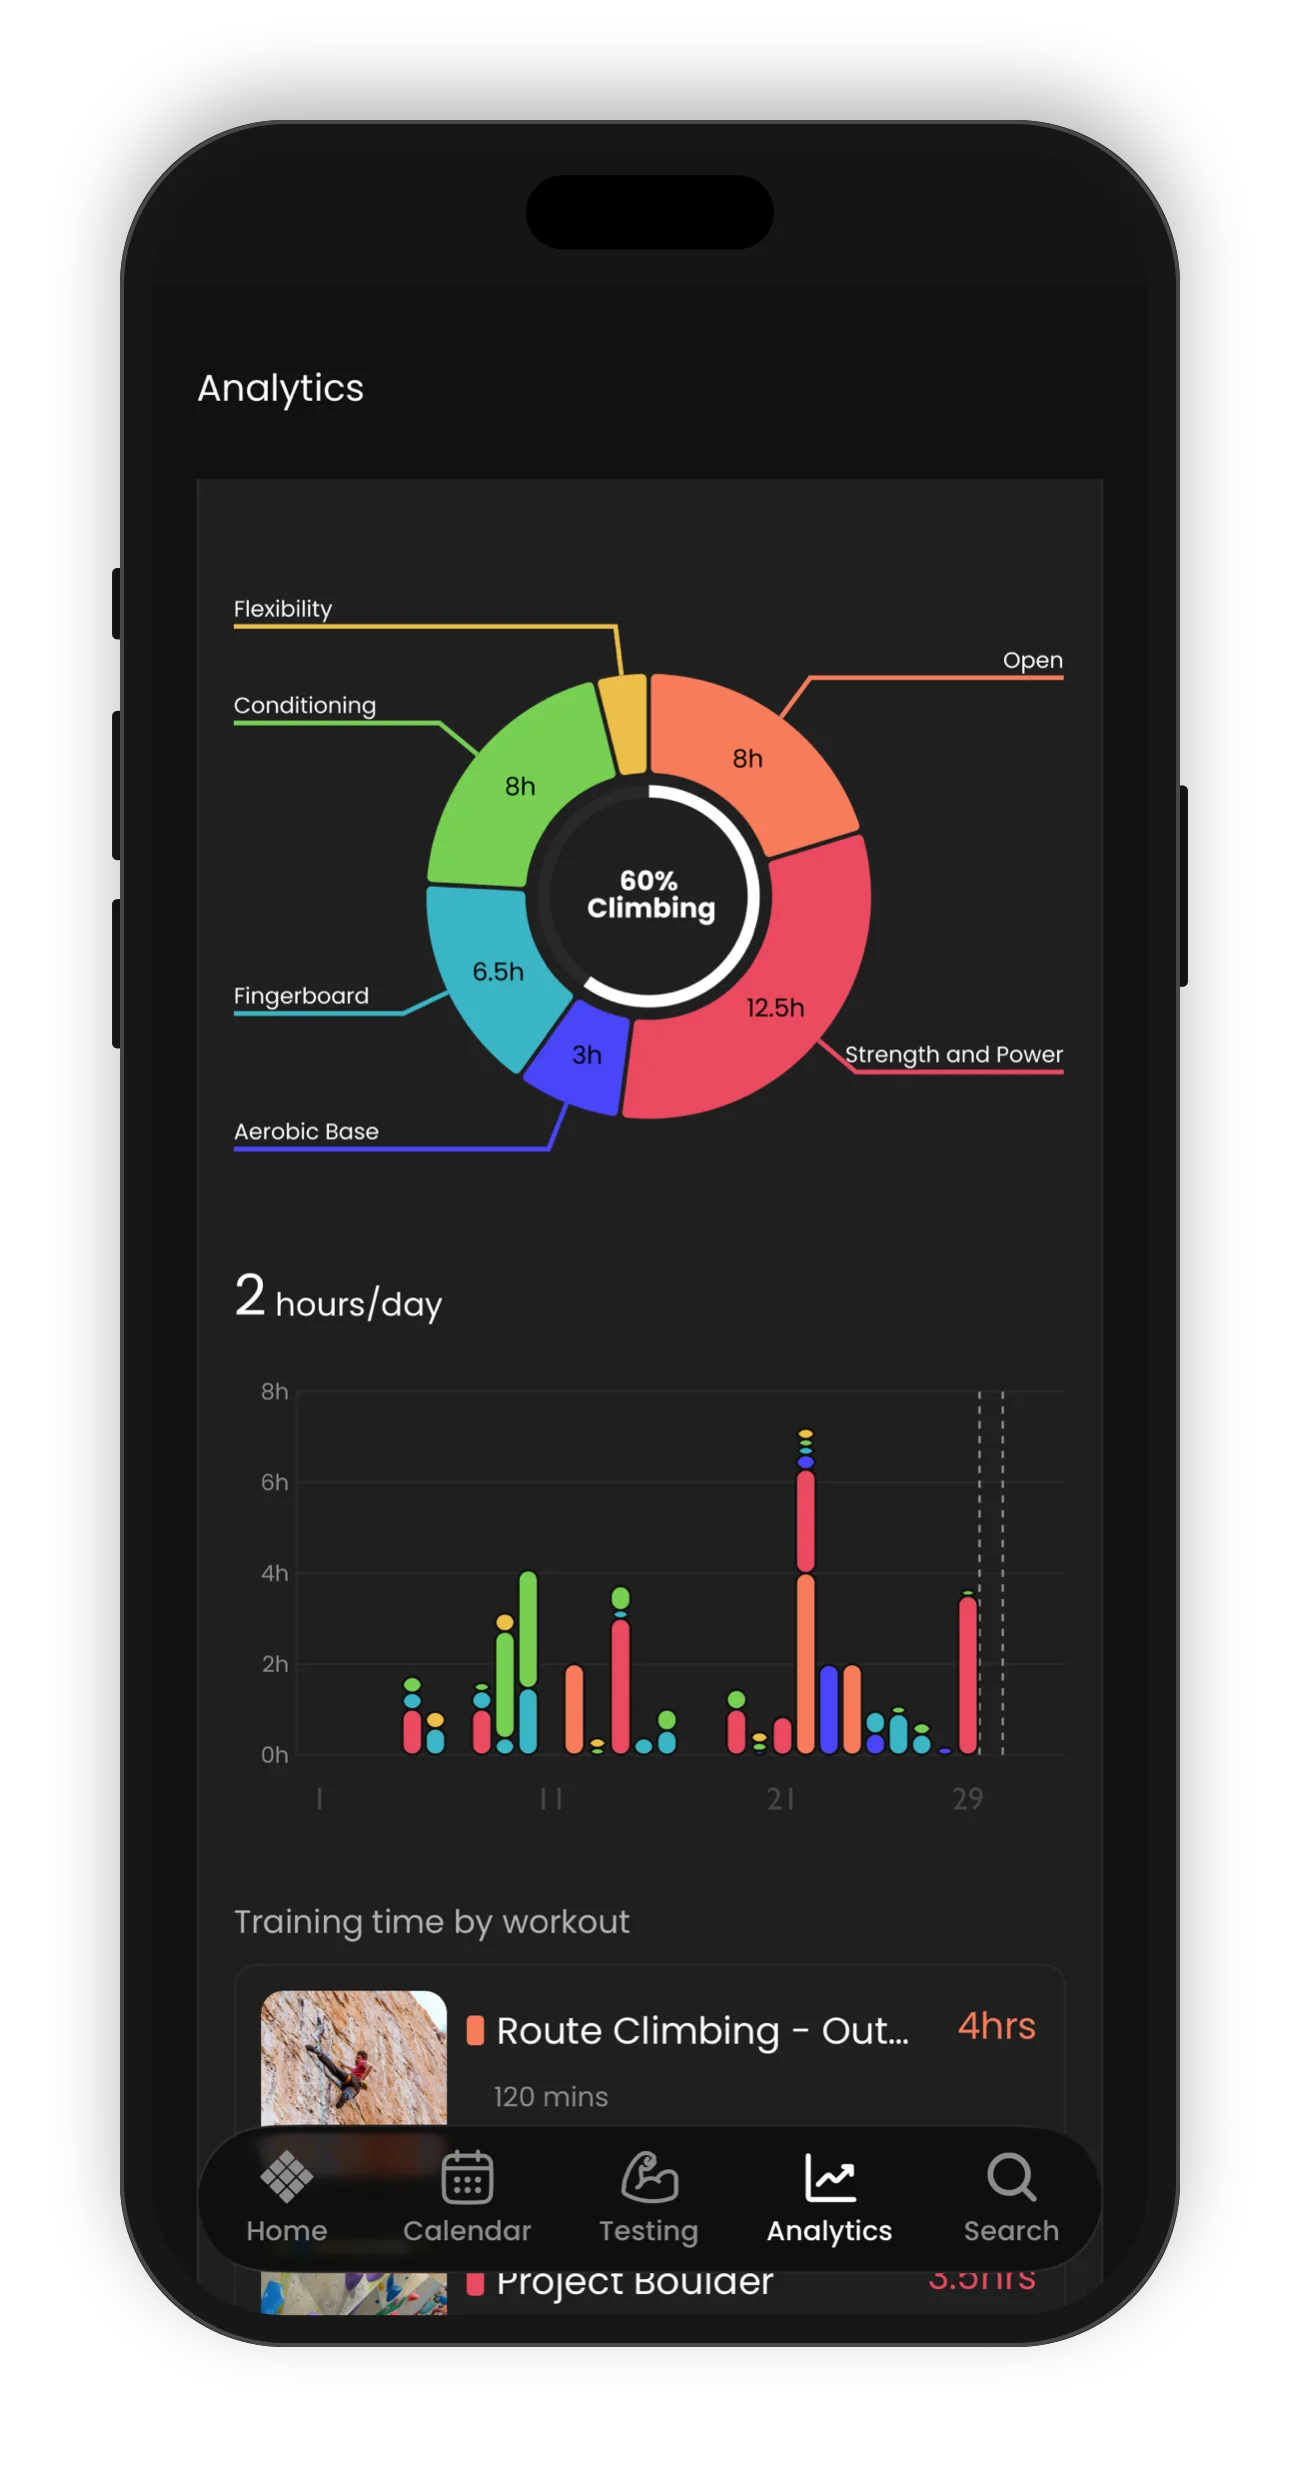
The last card shows your training. Tap the menu at the top left to choose Training time, Workouts or Training load. Tap the time frame at the top right to choose the period.
- The total for the period shows at the top.
- The ring shows your training by type of workout. The centre shows how much of it was climbing.
- The bars show your training for each day, week or month. The average shows above them.
- The list shows each workout. Tap Show more to see more of them.
To see one type of workout only, tap it on the ring. The total, the bars and the list then show only that type. To see all types again, tap it again.
Analytics on the free version
On the free version of the app, you see the training card. Sends by grade and Form come with a LatticePlan or a coached plan. On the free version they show as locked, with Unlock with LatticePlan.