Every Moonboard Problem Ever, Analysed
On today’s menu we have a special treat for you…we’re going to analyse every moon board problem ever created! I don’t really know what we’ll find, if anything, but I’m keen to get stuck in to the data and see what pops out. Im going to stick to the Moonboard 2016 setup for this post as it currently has a lot more problems than the 2017 setup (apologies for contradicting the title! The 2016 setup does cover 95% of the problems in the dataset so nearly all of them!)
The first question that comes to my mind: which holds get used the most?
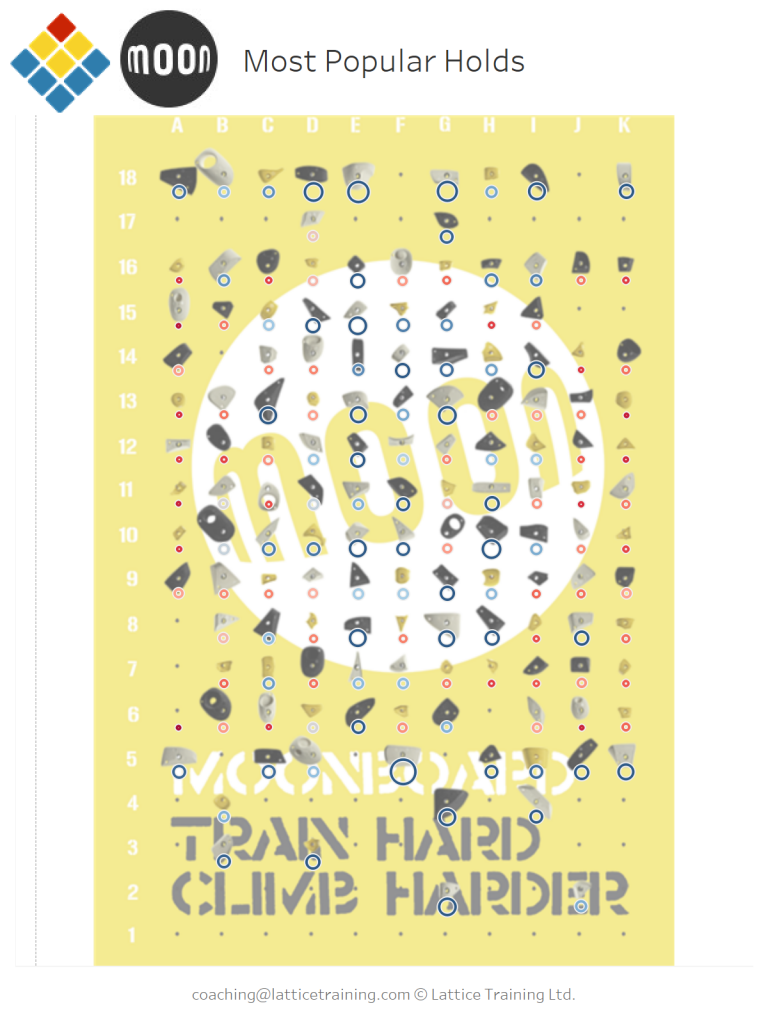

Big blue circles = most used, small red circles = least used. It looks like holds in the centre of the board tend to get used more often than those on the edges of the board. In practical terms this could make sense as creating problems towards the edge of the board can get tricky. It could also be due to the layout of holds on the board: perhaps people just prefer the holds that were put in the middle of the board so they tend to climb there more? It’s hard to say for sure.
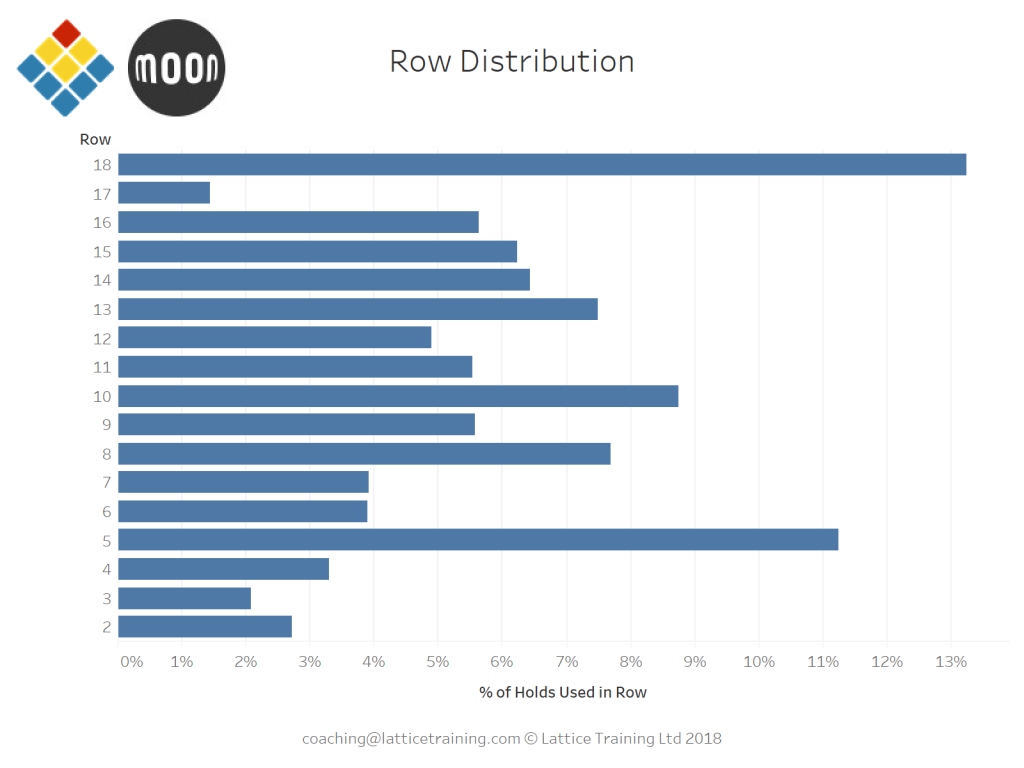
In a similar vein to the above we can look at which are the most popular rows and columns.
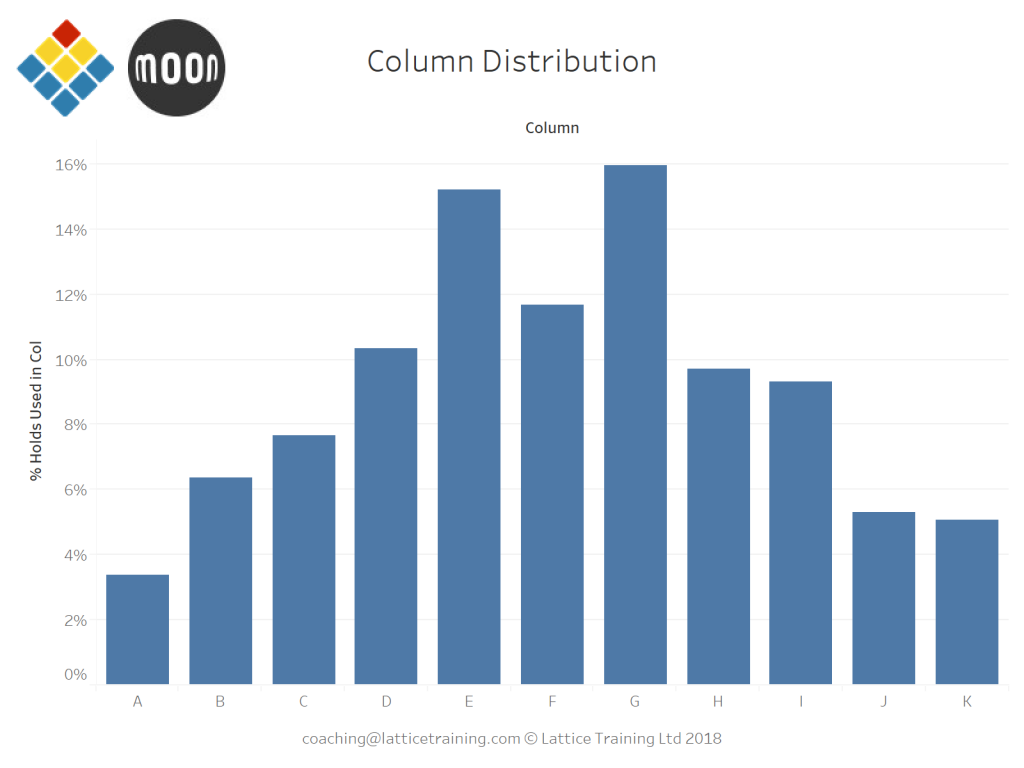


Looking at the columns graph our suspicion from the heatmap is confirmed. Holds in the centre of the board tend to get used a lot more than holds towards the outside. To me the symmetry around column F (the central column) suggests that the centre of the board isn’t just popular because of the holds used there, if this was the case I’d expect to see more noise around these central columns as climbers followed their preferred holds.
Interestingly the right hand side of the board is slightly more popular than the left with 45.4% of holds used being on the right, 43.0% on the left and the remainder in the middle. This might be an interesting effect, but it’s more likely to be a product of the hold layout.
Looking at the rows we see that #5 and #18 are particularly popular. This makes sense because a condition of adding a problem to the app is that it has a start (one or two holds on row #6 or lower) and an end (any hold in row #18). After that rows #10, #8 and #13 are the most popular. Looking back to the heatmap this is probably because there’s some pretty big holds on those rows, for e.g. H10, E10, C13. Low grade problems are likely to use bigger holds (citation needed) and there is a higher proportion of low grade problems than high grade problems, thus the bigger holds are likely to get more use.
Talking of grades, let’s have a look at how problems are distributed grade-wise.
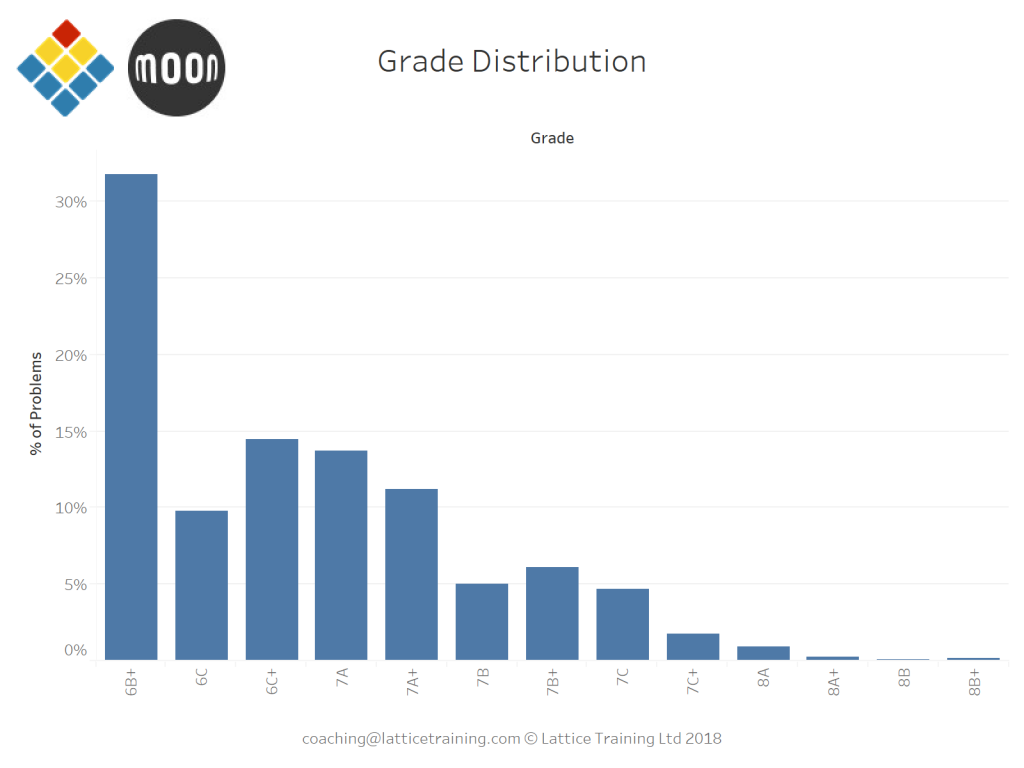

The large proportion of problems at 6B+ stands out here. My guess is that a lot of these are people testing out ‘add a new problem’ in the app as the default grade is 6B+. From there on the grade distribution is roughly as we’d expect (i.e. more easy problems than hard problems).
I wonder what will happen if we do the hold heat map from above, but instead of looking at hold popularity we look at the average difficulty of problems that use that hold?
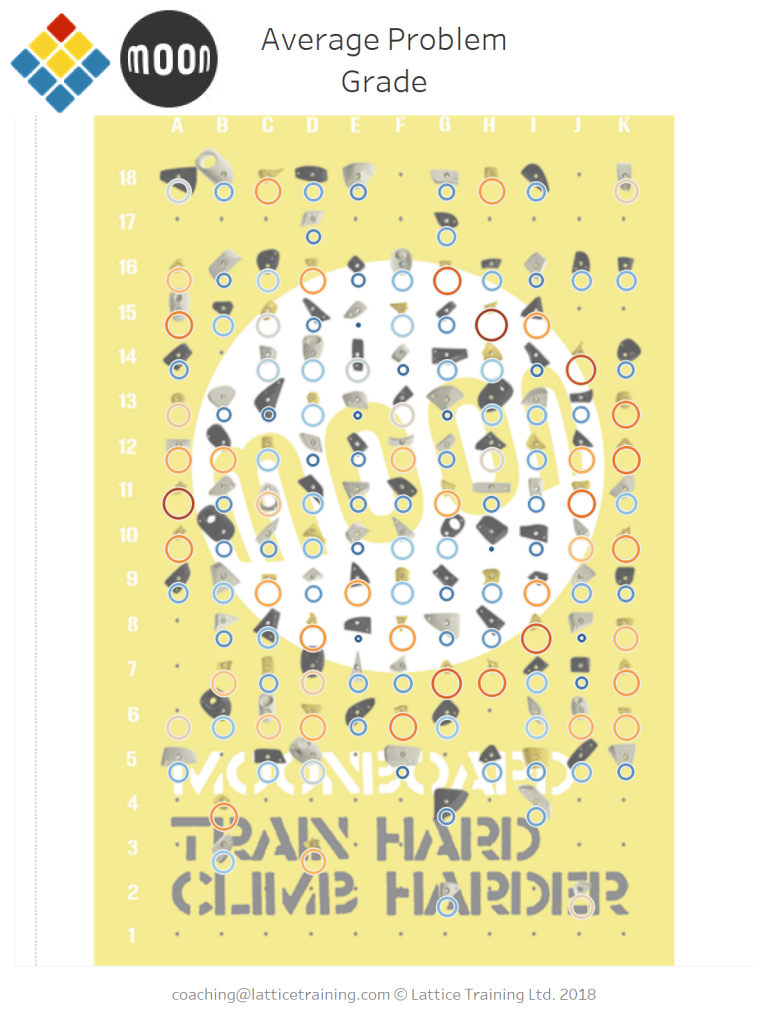

Big red circles = hard holds, small blue circles = easy holds. I had to eliminate all the problems graded 6B+ here because they were throwing all the numbers off. One interesting observation is that many of the yellow holds (aka The Original School Holds) tend to be used on harder problems. This makes sense as lots of them are tiny little desperates!
Now to have a little fun…can we make a problem that is democratically the easiest problem on the moonboard? How about the hardest?! Making an easy problem is…easier…because all we need to do is find the easiest start hold (F5), the easiest end hold (E18) and add easy holds in easy->hard order until we’re left with something vaguely climbable. Future classics? I’ll let you be the judge of that…
Democrats Problem 3 Democrats Problem 3.1 (Just noticed I messed up problem 3 and selected all the wrong holds, doh!)
What happens if we try a similar thing with the most difficult holds?
I’ll stop there because, while these problems are obviously hard, they’re probably also rubbish and will clutter up the app. What we’ve basically done is a classic trap for poor setters…small holds far apart.
I’ve already spent too long on this so I’ll leave it here for the moment. If you’ve got any thoughts for cool analysis we could do with this data or questions about this piece then you can leave a comment below or drop us an email.


Where did you download the coordinates for each problem? I’d like to do my own analysis because I’m thinking about building a smaller than regulation board that fits in my home.
Thanks!
Hi,
Something cool you could do is measure the average length of moves using the position of each hold. The first obvious plot would be of the average move length as a function of grade. One would expect the length of moves to grow with grade but may level off at some point ( a 7C that that is only hard cuz it has enormous moves probably isn’t that popular). You could also compare this to the crapiness of the holds as a function of grade (use your data from the article above to give each hold a score and rate each problem on those hold scores). It would be cool to show that large moves and bad holds are anti-correlated.
There seems to be a little coding work to figure out how to get a program to figure out the way to move through the holds in a way that minimizes the lengths of moves of a problem. Seems like fun!
Are the figures above adjusted for popularity or is each problem counted just once?
This is a cool article, thanks!
Feel free to hit me up.
Thanks,
Blair